EN
EN
What filter matching rule for dust proof cabinet cooling fan operating in cement factories
2026/09/30
Cement cabinets choke on dust. Learn the filter rule for an industrial cabinet cooling fan: G4/F7 media, IP rating, and pre-filter care.

2026/09/02

When specifying heat management systems for power enclosures, industrial inverters, or control cabinets, procurement teams often focus on one big number: total cubic feet per minute (CFM). High airflow numbers look fantastic on a product datasheet. However, field engineers frequently encounter a frustrating reality: a high airflow cabinet cooling fan delivers its promised output, yet components inside the enclosure still overheat.
The culprit is rarely total volume. It is uneven air distribution.
Dead spots across a fan’s discharge outlet allow localized temperatures to soar, even when the overall volumetric flow rate meets theoretical thermal calculations. For large industrial cooling fans, airflow distribution across the outlet plane is a primary quality metric. Achieving thermal stability in dense electronic enclosures requires testing airflow uniformity directly rather than assuming a uniform velocity profile.
Total airflow measures how much air moves through a fan per unit of time. Uniformity measures how that air passes across the discharge aperture. In real‑world cabinet designs, air rarely moves in a perfectly symmetrical column. Axial fan hubs create central dead zones, blade geometry introduces rotational swirl, and motor struts generate wake shadows.
When a high airflow cabinet cooling fan features severe velocity gradients across its face, the downstream air takes the path of least resistance. Enclosure components positioned directly in high‑velocity streams experience rapid heat dissipation. Conversely, sensitive power electronics positioned downstream of low‑velocity dead zones or hub shadows suffer from severe thermal stagnation.
This imbalance creates severe operational risks:
To eliminate guesswork during thermal validation, engineers rely on international fan testing standards to quantify distribution quality. Chief among these is ISO 5801, which specifies industrial performance testing using standardized airways, pressure chambers, and traverse planes.
Applying ISO 5801 testing principles to airflow uniformity evaluation requires setting up a calibrated test duct or an outlet traverse plane equipped with a multi‑point sensor grid.
表格
| Parameter | Standard Grid Traverse | Single‑Point Probe | Full‑3D Scanning Rig |
|---|---|---|---|
| Point Density | 9 to 25 Sampling Points | 1 Centerline Point | 50+ High‑Density Points |
| Defect Detection | Catches shroud warp & blade eccentricity | Misses edge drops & radial dead bands | Captures micro‑turbulence & blade swirl |
| Repeatability | High (Fixed work instructions) | Low (Vulnerable to local shifts) | Very High (Automated positioning) |
| Application | Production line QA & incoming inspection | Basic screening (Not recommended) | R&D prototype validation |
Key Takeaway: Measuring static pressure or average CFM at a single center point hides dangerous boundary layer drop‑offs. Adhering to ISO 5801 multi‑point grid sampling gives thermal engineers actionable velocity maps to guarantee enclosure safety margins.
To set up a reliable airflow uniformity test protocol on an industrial assembly line, the testing environment must remain completely isolated from ambient room drafts and thermal recirculation.
Documenting point spacing, sensor alignment, and dwell time within standard operating procedures ensures that audits can reproduce results across different shifts or manufacturing facilities.
Once velocity readings across the grid are recorded, airflow uniformity is quantified using statistical parameters. The two standard metrics used in quality control are the Coefficient of Variation (CV) and the Min‑to‑Mean Ratio (Rmin).
The average velocity across the grid is calculated by adding all measured velocity readings and dividing by the total number of sampling points.
Formula:
Average velocity = Sum of all velocity readings ÷ Number of sampling points
Where:
v₁, v₂, vₙ = individual velocity readings at each sampling point n = total number of sampling points
Standard deviation measures how much the individual velocity readings vary from the average velocity. A low standard deviation means the velocity profile is more uniform.
Formula:
Standard deviation = Square root of [ sum of (individual velocity − average velocity)² ÷ number of sampling points ]
The Coefficient of Variation expresses velocity variation as a percentage of the average velocity. It is the primary metric for evaluating airflow uniformity.
Formula:
CV = (Standard deviation ÷ Average velocity) × 100%
The Min‑to‑Mean Ratio compares the lowest measured velocity to the average velocity across the grid. It helps identify severe dead spots that average CFM alone cannot reveal.
Formula:
Rmin = Minimum measured velocity ÷ Average velocity
Acceptance Criteria for Industrial Enclosures
Units exhibiting a CV above 15% indicate physical anomalies—such as shroud misalignment, uneven blade pitch, or motor mounting offset—and must be routed to rework rather than shipped to customers.
An industrial enclosure manufacturer experienced unexplained component overheating in power inverters fielded across desert environments. Although every installed high airflow cabinet cooling fan passed total volumetric CFM testing at final assembly, field return rates continued to climb.
Engineering teams implemented an ISO 5801 aligned grid traverse audit on incoming fan shipments. The results were revealing:
This case underscores why relying solely on total flow figures leaves thermal systems vulnerable to unpredicted field failures.
When sourcing thermal management hardware for critical infrastructure, procurement specifications must go beyond static performance curves. Requesting documented compliance with established fan testing standards during supplier evaluation prevents costly design iterations later.
Sourcing Checklist for Procurement Teams
Manufacturing partners with advanced aerodynamic test chambers and automated production lines, such as Lobisong, integrate grid traverse testing directly into quality control pipelines. By controlling housing tolerances, motor concentricity, and blade balance, Lobisong delivers high‑performance industrial fans that maintain predictable thermal margins. Supported by extensive international export experience across Europe, North America, South America, and Asia, Lobisong provides fully traceable test documentation and global supply chain reliability to meet stringent B2B thermal management requirements.
Treating velocity distribution as a core engineering specification ensures cabinet designs run cooler, last longer, and operate predictably in demanding environments.
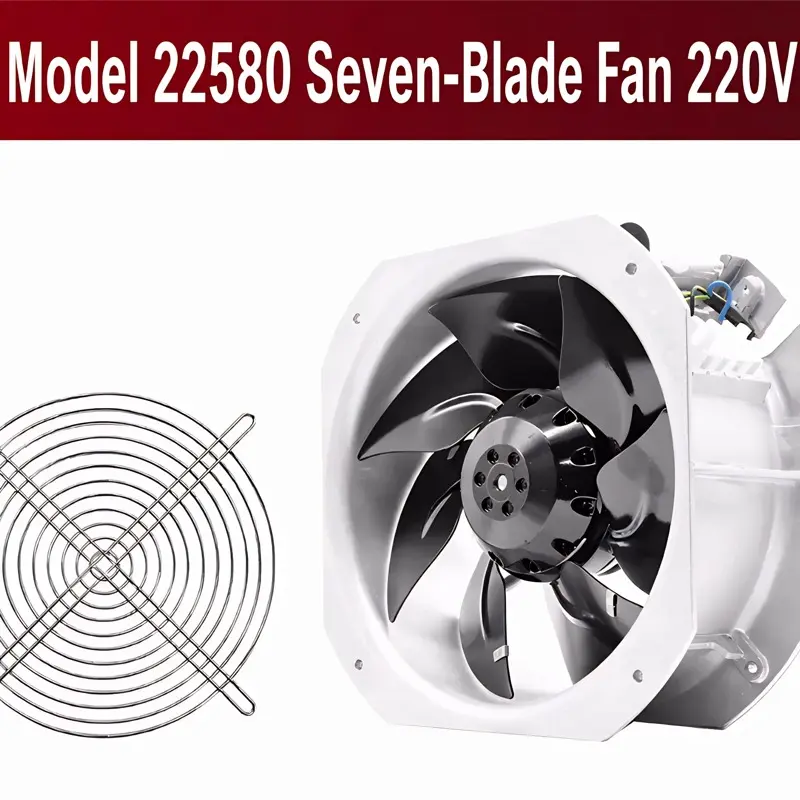
2026/09/30
Cement cabinets choke on dust. Learn the filter rule for an industrial cabinet cooling fan: G4/F7 media, IP rating, and pre-filter care.

2026/10/07
Right wall-mount height for an industrial axial exhaust fan: room volume, free clearance, brackets, and recirculation control.

2026/10/08
An ec motor fan links to BMS via Modbus, 0-10V and PWM for demand-based cooling, energy scheduling and automatic sensor-driven speed control.
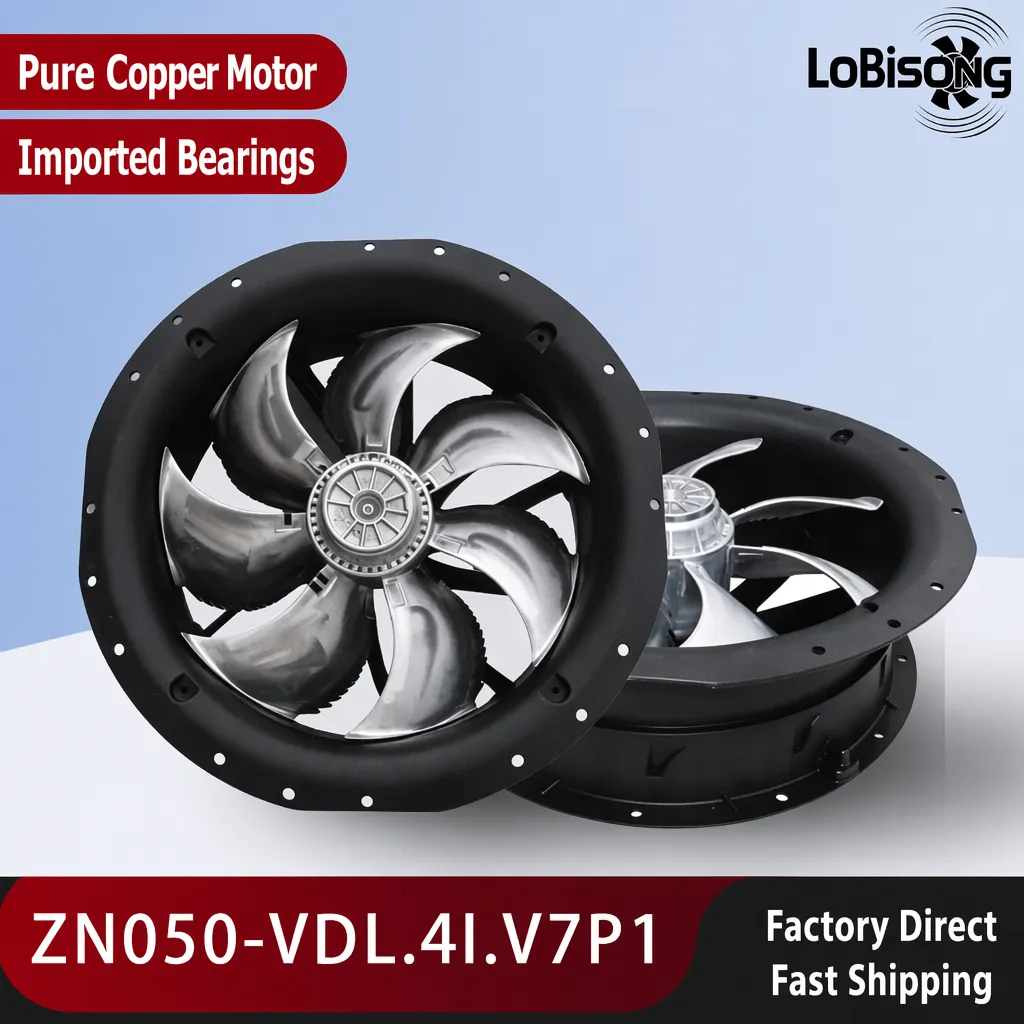
2026/10/06
A radial exhaust fan removes grease, fumes, and odors from food-processing workshops with capture velocity and hygienic washdown design.
2026/10/05
Learn antistatic treatment for industrial cabinet cooling fan in electronics workshops—ESD-safe housing, ionizable plastics, and cleanroom compatibility.
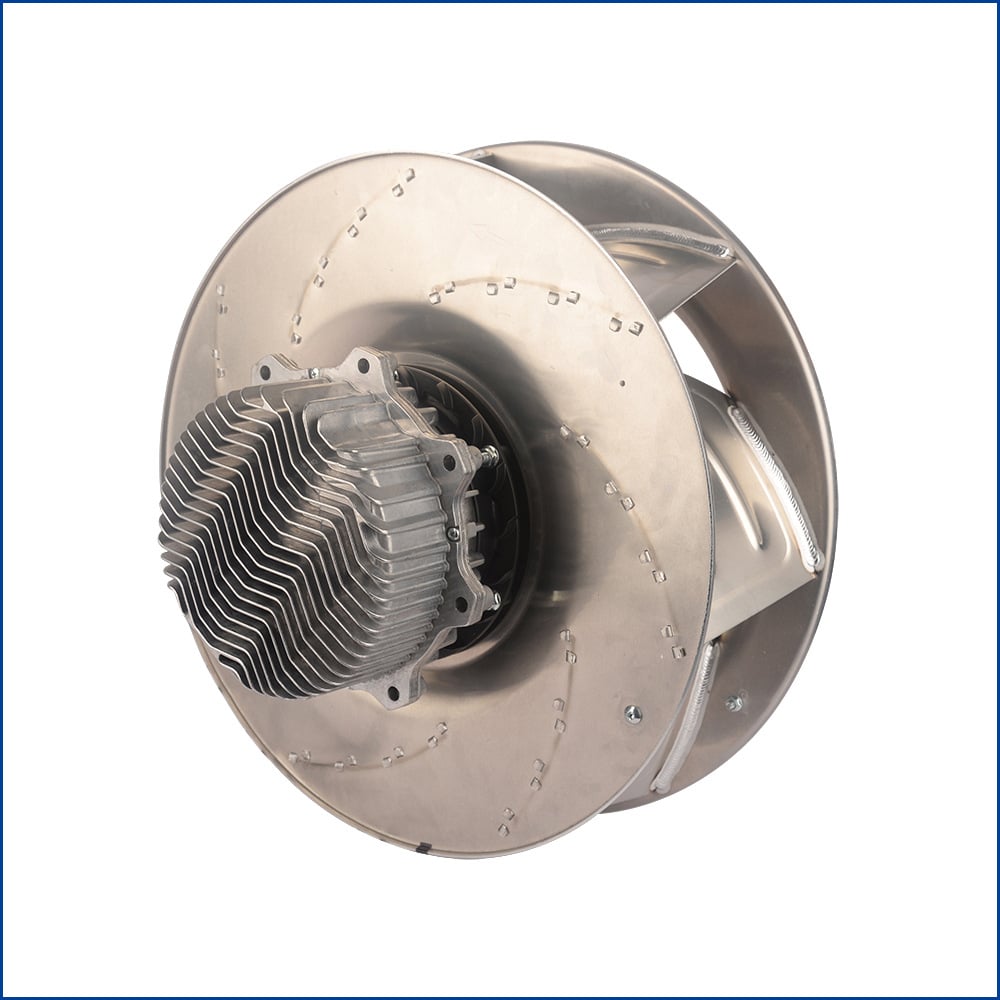
2026/10/04
Discover how a brushless dc servo delivers precise wind speed control for laboratory cooling fans with closed-loop PID feedback and laminar airflow.